Boundless Immersive
Placeholder: a muted looping reel of a live dashboard filling with data, a heatmap, an AI summary surfacing a trend.
Insights

An experience is only as good as what you learn from it. So we measure all of it.

We build the data layer underneath everything we make: capturing what people actually do, turning it into dashboards you own, connecting it to your systems, and using AI to turn all of it into evidence of what works.

The difference

Anyone can build the experience. We prove it worked.

Most experiences capture a completion and little else. We instrument what we build from the start, so every interaction, decision, and hesitation is data you can act on. The experience is only half the value. What you learn from it is the other half.

Data nobody reads changes nothing. So we use AI to read all of it: finding the patterns a person would miss, flagging what's working and what isn't, and connecting what happened in the experience to what happened in the business. The result isn't a chart. It's evidence, and a clear sense of what to do next.

What measurement becomes
  • Every interaction
    Captured by design, not just a completion tick.
  • 20%
    Configurator users are more likely to buy. The data shows you which ones, and why.
  • One view
    Learning, sales, and capture data, correlated to the business outcomes that matter.
Sources: industry studies.
How we work

The way the work actually moves.

Five passes from the question you need answered to a dashboard your team is using.

Discover.

We start with the question that matters: did it work, and how would you know.

Define.

We agree the metrics that count and the business outcomes to tie them to.

Design.

We design the measurement into the experience, and the dashboard around your decisions.

Develop.

We instrument the build, connect it to your systems, and put the AI layer on top.

Deliver.

The dashboard handed over, live and yours, with the data flowing from day one.

What we make

Five parts of turning an experience into evidence.

Insights works as a page in its own right, or as a layer added to anything else we build. Most engagements use several of these, with AI running through all of them.

Data capture and instrumentation.

Measure what people actually do, not just whether they finished.

We build the measurement into the experience from the start, so every interaction, decision, and drop-off is captured by design, not estimated afterwards. It's the difference between knowing someone completed a module and knowing where they hesitated, what they got wrong, and what they came back to. The richer the capture, the more there is to learn.

Who it's for

Learning, sales, and operations teams who need more than a completion rate.

Formats

xAPI and event tracking, scenario-level telemetry, web and headset, custom events.

What we measure

Whatever the experience produces: interactions, decisions, time, attempts, paths.

Lead time

Built alongside the experience.

Dashboards and reporting.

The whole picture, in one place, yours from day one.

We turn the raw data into dashboards your team actually uses: completion and retention, engagement and drop-off, conversion, and the numbers that prove a return. Built around the decisions you need to make, with AI summaries that tell you what changed and where to look, so you're not left reading charts on your own.

Who it's for

Programme owners, team leads, and the people who report upwards.

Formats

Custom dashboards, browser-based, scheduled reports, AI summaries, natural-language queries.

What we measure

Completion, retention, engagement, conversion, ROI, whatever the programme needs.

Lead time

4–8 weeks for a production dashboard.

Systems integration.

The data where you already work, not in another silo.

The functionality that sits behind what we build: xAPI, SCORM, LTI, SSO, and a Learning Record Store on the learning side, CRM and event tracking on the sales side. We connect what we make to the systems you already run, so the data lands in your LMS, CRM, or BI tools and joins everything else you measure.

Who it's for

Learning, sales operations, and IT teams running existing platforms.

Formats

xAPI, SCORM, LTI, SSO, LRS, CRM, BI connectors, API.

What we measure

Data flowing cleanly into your systems, as a single source of truth.

Lead time

3–6 weeks, depending on the systems.

Effectiveness and ROI measurement.

Proof that it worked, in terms the business recognises.

We connect what happened in the experience to what happened in the business: completion against the old way, behaviour change on the job, performance, and cost and time saved. By correlating experience data with business data, time in a module against handling time, training against retention, we turn engagement into a return you can defend.

Who it's for

Anyone who has to justify the investment, from learning leads to the board.

Formats

Pre and post analysis, cohort comparison, business-data correlation, ROI reporting.

What we measure

Behaviour change, performance, retention, cost and time saved, return on investment.

Lead time

Per cohort, ongoing.

AI insight.

Data nobody reads changes nothing. AI reads all of it.

We put an AI layer over everything we capture: finding the patterns a person would miss, flagging what's working and what isn't, and recommending what to do next. Ask it a question in plain language and get an answer from your own data. It runs through everything we build, and it's where we're putting the most energy right now, because the volume of data an immersive experience produces is more than any team can read by hand.

Who it's for

Every team with more data than time to read it.

Formats

Pattern detection, anomaly flagging, natural-language queries, recommendations, AI summaries.

What we measure

What's working, what's not, and what to do next, surfaced automatically.

Lead time

Layered onto the dashboard.

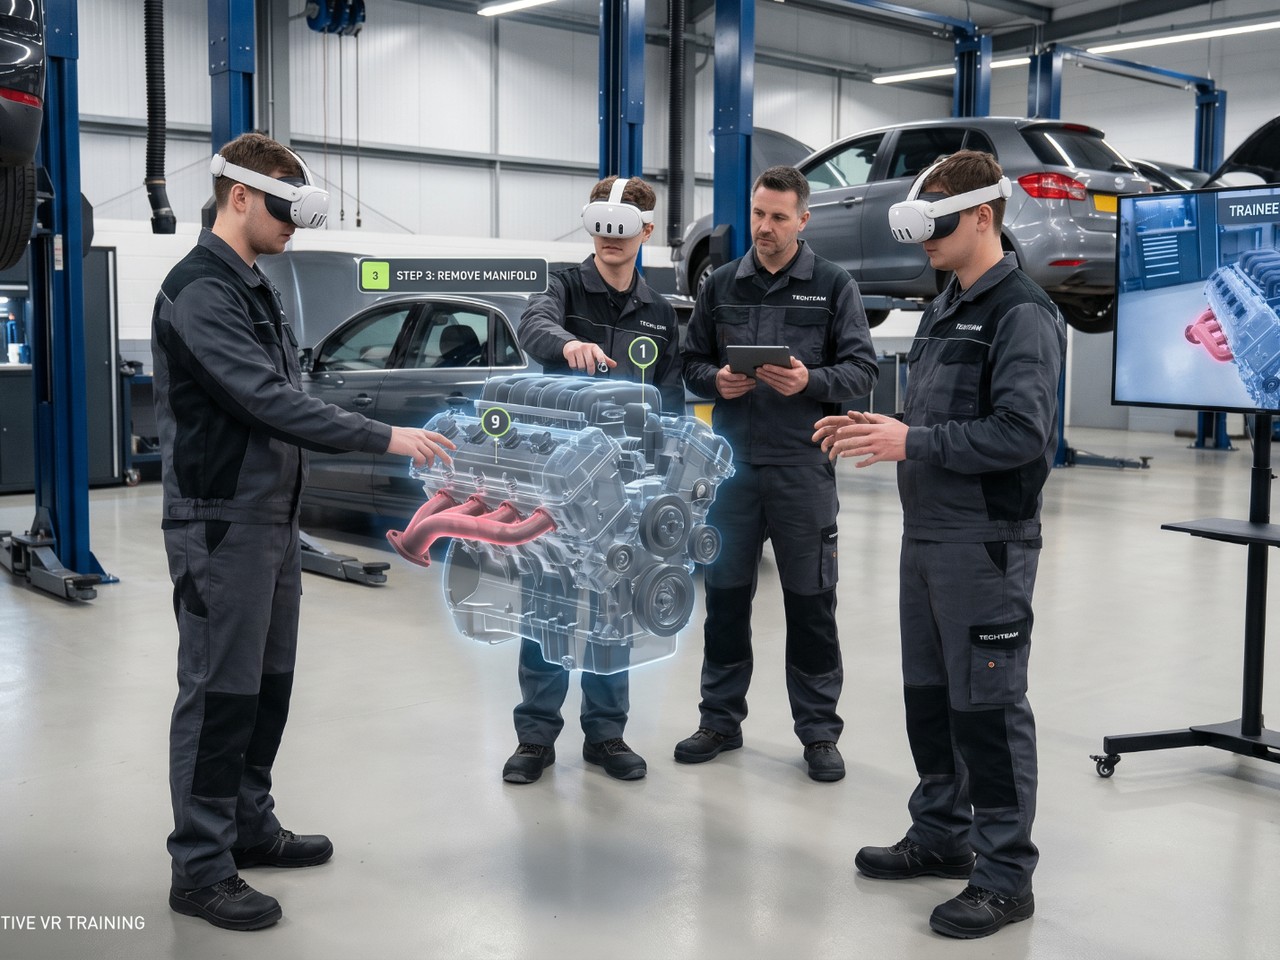
Telemetry visualisation of an immersive experience capturing every interaction.
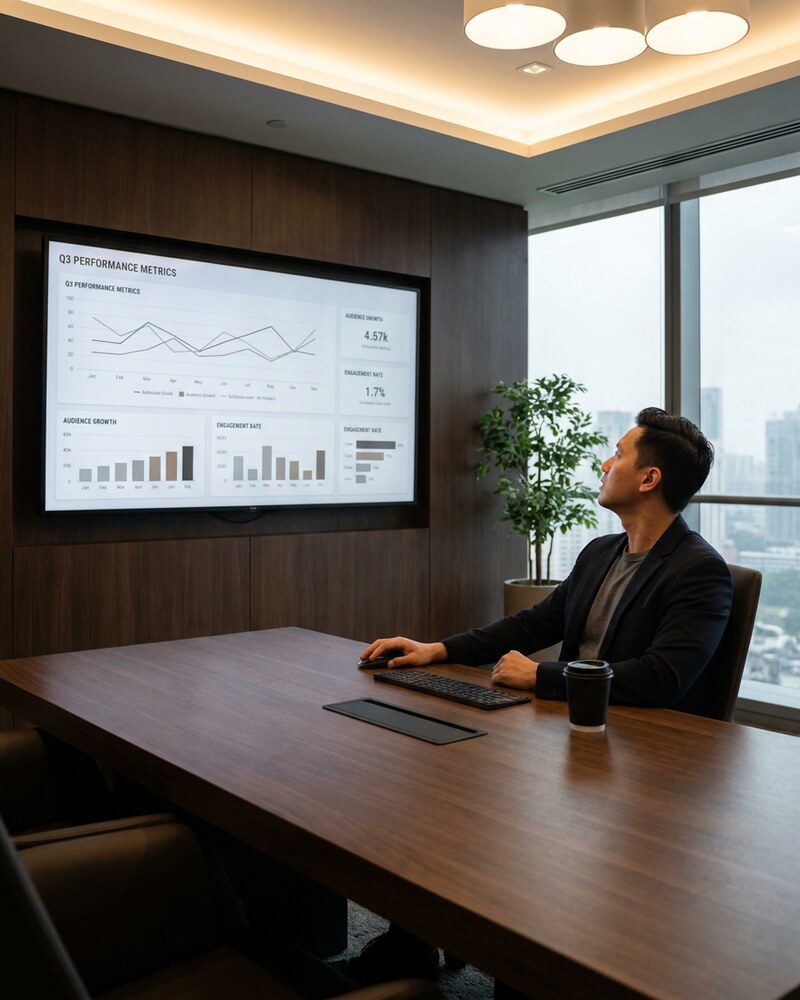
A live dashboard with completion, retention, and engagement panels.
Data flowing cleanly from an immersive experience into an LMS and CRM.
Pre and post analysis correlating experience data with business outcomes.
An AI summary surfacing a pattern across thousands of interactions.
In practice

What the data told the teams we built it for.

The measurement behind the work, and what it let them prove.

Boundless · Flow

Flow

Continuous development, creative technology, and support.

Boundless Flow gives you access to an experienced creative technology team without the overhead, delays, or large upfront investment of traditional project delivery.

From immersive experiences and interactive platforms to AI integrations, visualisation, reporting and ongoing optimisation, we work as an extension of your team — designing, building, launching and evolving digital experiences continuously over time.

A single monthly investment gives you predictable access to strategy, design, development, content, support and iteration — so projects move faster and scale as priorities evolve.

What's included
  • 01StrategyRoadmaps, prioritisation, shaping the work
  • 02DesignBrand, UI, motion, interaction & systems
  • 03DevelopmentWeb, immersive, AI integrations & platforms
  • 04ContentFilm, CGI, visualisation, reporting
  • 05SupportLive monitoring, fixes, optimisation
  • 06IterationContinuous shipping as priorities evolve
One monthly investment · One team · Continuous delivery
Accepting new Flow partners
Let's talk

Building something, and want to know whether it's working? We'd like to hear about it.

Book a discovery call, email us, or leave your address and we'll come to you.

or leave your email
We reply within 24 hours. No list, no follow-ups.